Summary: A production-grade order fulfillment pipeline built with Elixir, Phoenix, and OTP — the core technology stack used by supply chain software companies building OMS/WMS/TMS systems. Each order runs as its own supervised OTP process. Exceptions get diagnosed by Claude AI. The entire pipeline updates in real time via Phoenix LiveView without a line of JavaScript.
This isn’t a tutorial project. It’s a working OMS/WMS domain application built to demonstrate fluency with Elixir/OTP architecture, fault-tolerant system design, and AI-assisted exception management — built in under two weeks, starting from zero Elixir experience.
Links: GitHub: https://github.com/bbornino/phoenix_fulfillment_pipeline
Tools & Tech Stack
- Language: Elixir 1.20
- Framework: Phoenix 1.8 with Phoenix LiveView
- OTP: GenServer, DynamicSupervisor, Registry, Task.Supervisor
- Database: PostgreSQL via Ecto
- Real-time: Phoenix PubSub
- AI: Anthropic Claude API via anthropix
- Pagination: scrivener_ecto
- Frontend: DaisyUI / Tailwind (no custom JavaScript)
- Testing: ExUnit — 69 passing tests
The Fulfillment Pipeline Dashboard
The heart of the app is a Phoenix LiveView dashboard showing all active orders and their current pipeline status in real time. Order statuses are color-coded — gray for received, amber for picking and packing, blue for shipping, green for delivered, red for exception. Advancing an order through the pipeline or triggering an exception updates every connected client instantly via PubSub, with no page refresh and no JavaScript.
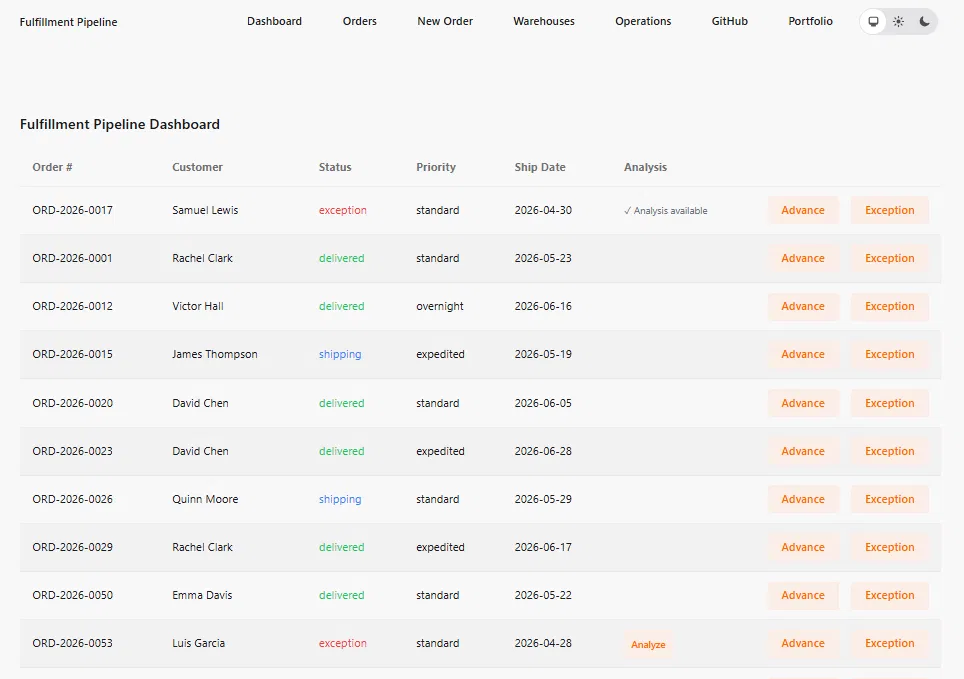
Exception orders show either an “Analyze” button or a “✓ Analysis available” indicator. Clicking Analyze kicks off a Claude AI analysis in the background — more on that below.
Claude AI Exception Analysis
When an order hits exception state, the app has enough context to do something useful with it. Clicking Analyze triggers a supervised Task that calls the Claude API with the full picture: order details, line items, current inventory levels at that warehouse, carrier, priority, and how long the order has been stuck.
Claude returns a structured analysis: root cause, 2-3 resolution options with action items, a customer notification draft, and a pattern risk assessment. The result saves to the database and broadcasts back to the dashboard via PubSub.
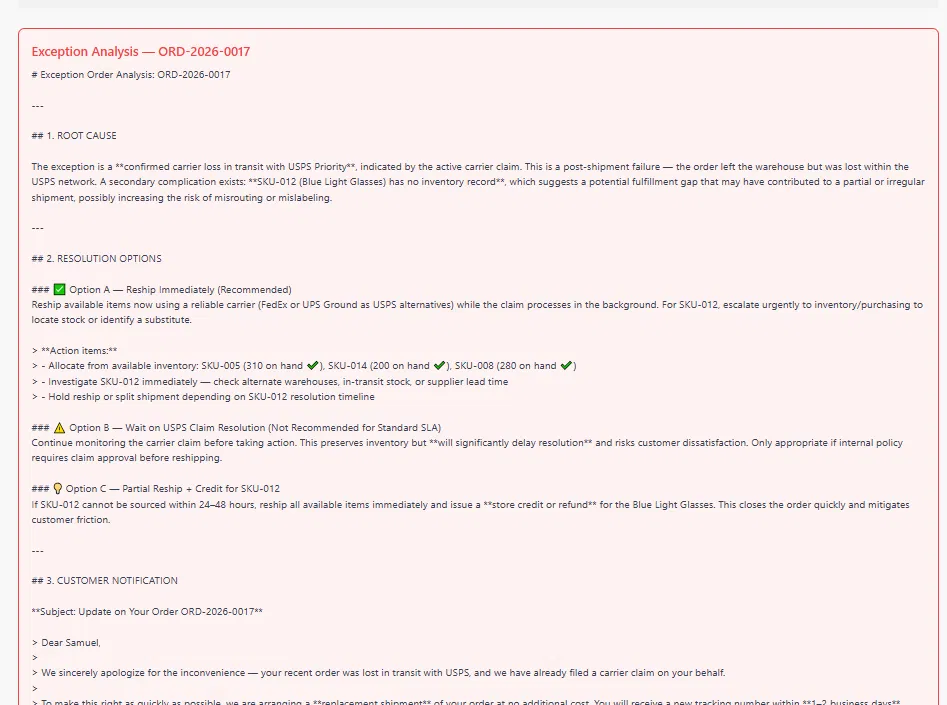
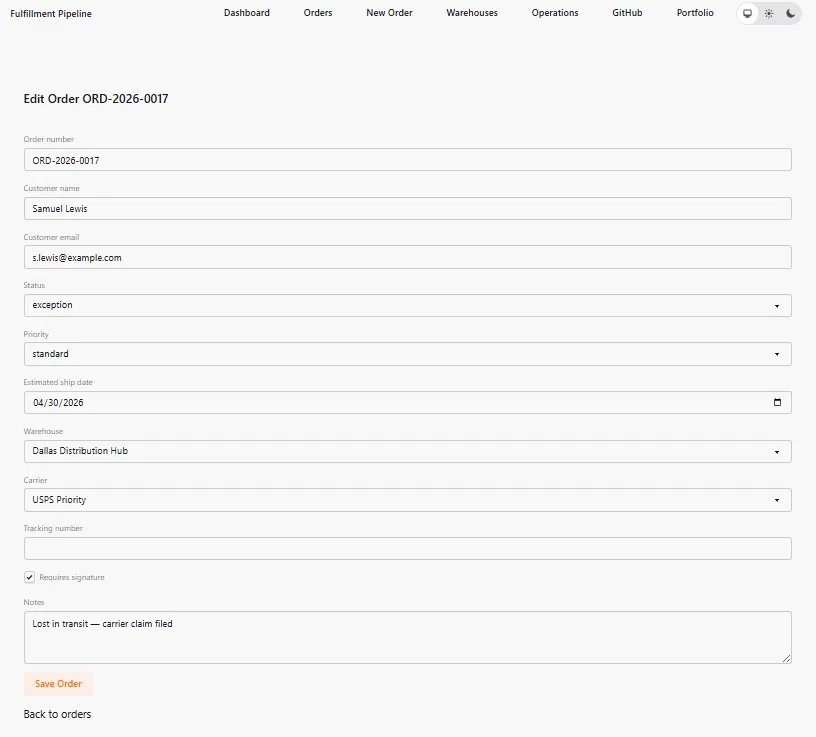
The analysis above is real output — not mocked. Claude identified a confirmed carrier loss in transit with USPS, flagged a missing inventory record for SKU-012 as a secondary issue, and produced three tiered resolution options with specific action items for each. The customer notification is ready to send.
The Task runs independently of the websocket connection. If the browser times out during the API call, the analysis still completes and appears when the dashboard reconnects.
Order Management
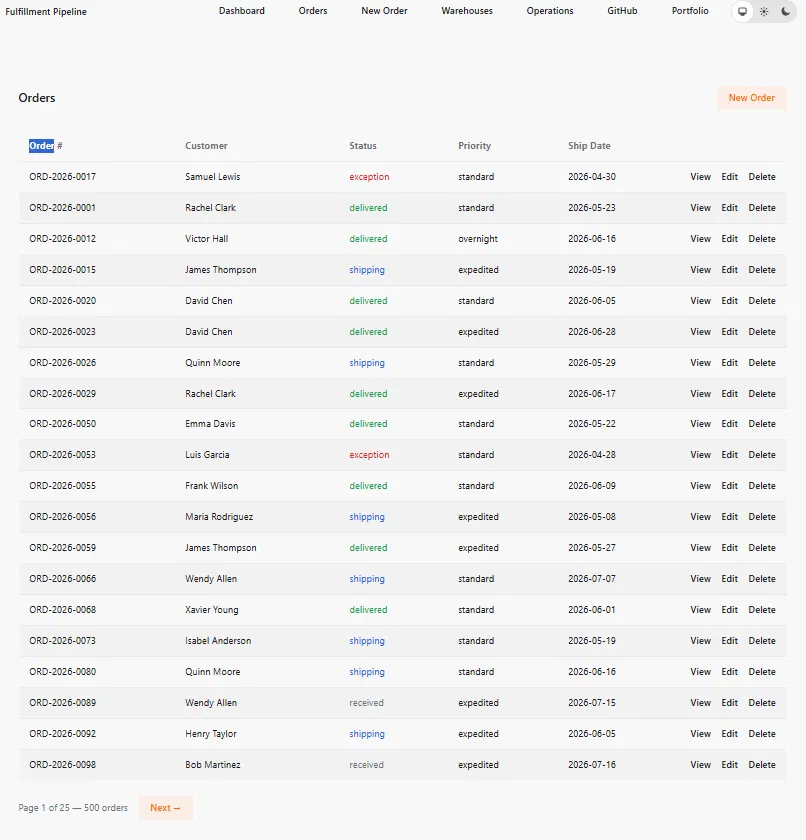
The orders list shows 500 seeded orders across 25 customers, paginated 20 per page. Status colors carry through from the dashboard. Each order links to a detail view, edit form, and delete confirmation.
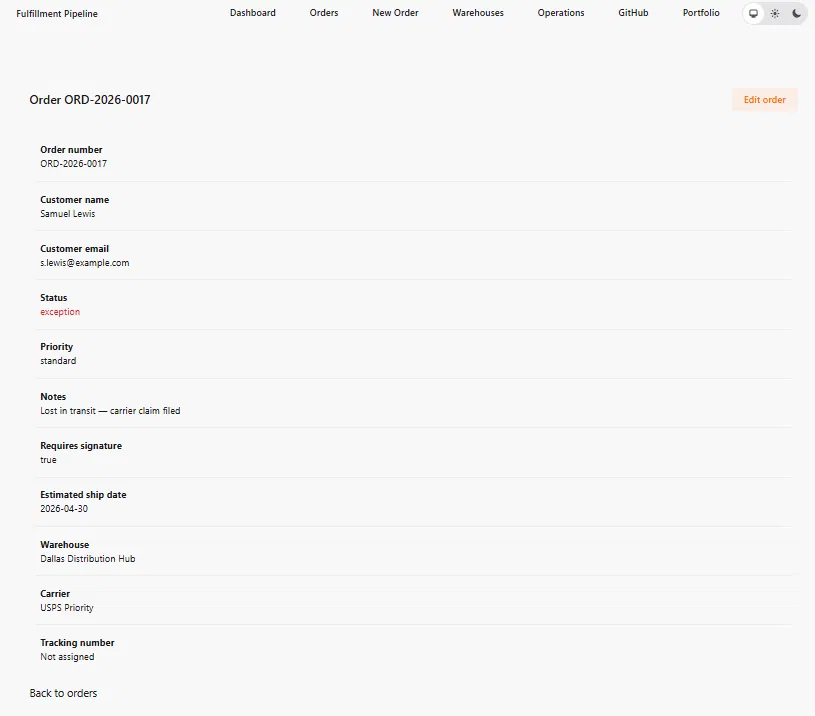
The order detail page shows all fields including warehouse name (not a raw ID), carrier assignment, tracking number, and exception notes populated from the seed data narrative.
The edit form uses dropdowns for status, priority, warehouse, and carrier — all validated against the changeset. Warehouse and carrier are relational lookups, not hardcoded lists.
Operations Dashboard
A second LiveView handles operational visibility across the network. Carriers, low stock alerts, and per-warehouse inventory browsing — all in one place.
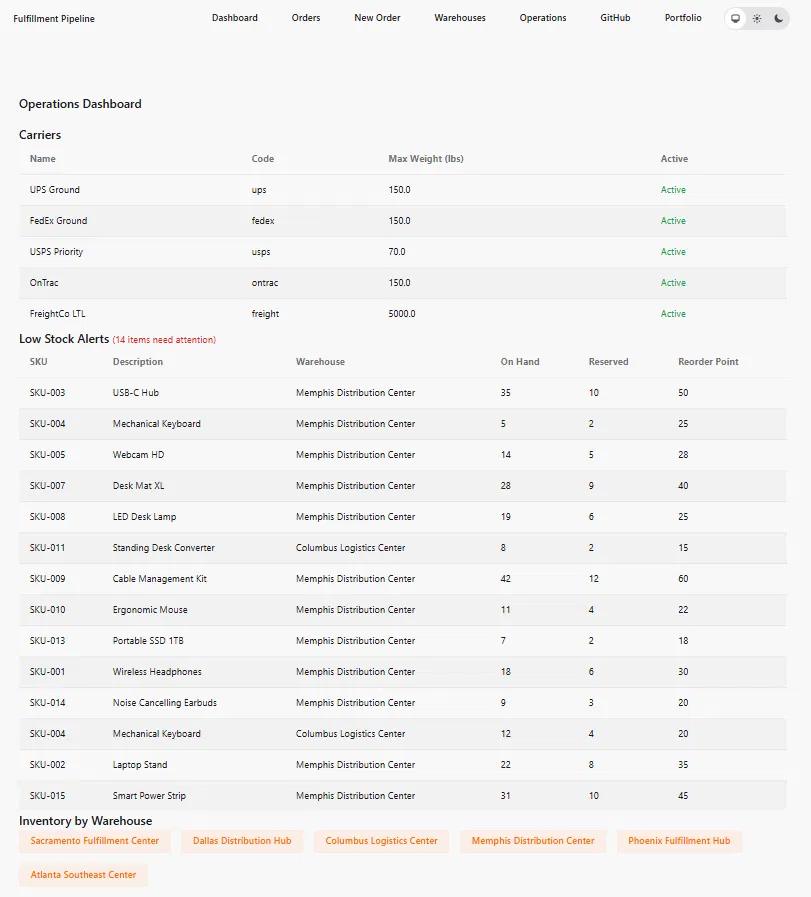
The low stock alerts tell the Memphis story clearly: 11 of the 14 flagged items are at the Memphis Distribution Center. That’s the narrative pattern baked into the seed data — Memphis runs chronically understocked, which feeds its higher exception rate on the pipeline dashboard. This is the kind of pattern Claude can identify and explain when analyzing an exception order routed through Memphis.
Clicking any warehouse button loads its full inventory inline — no page navigation, no reload.
Warehouse Management
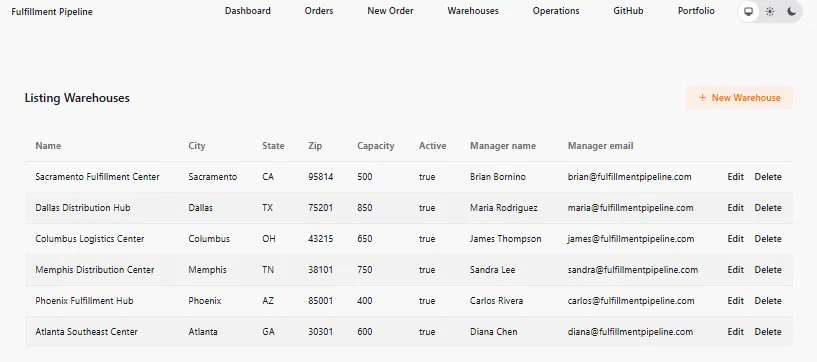
Six fulfillment centers across the US, each with capacity, manager contact, and location data. Full CRUD — add, edit, delete. Orders carry a foreign key to warehouses; deleting a warehouse with active orders is blocked at the database level.
Architecture
GenServer per order, not a single process for all orders. Each active order is its own OTP process holding live in-memory state. A crash in one order process doesn’t affect any other. The DynamicSupervisor detects the crash and restarts the process, which reloads its state from Postgres automatically. This is verified in the test suite by killing a process with Process.exit(pid, :kill) and asserting the Supervisor restarts it under a new PID with correct state — the “let it crash” philosophy made testable.
Registry for stable process lookup. GenServer PIDs change on restart. The Registry maps a stable key (order ID) to the current PID. Callers look up an order by ID and the Registry resolves the current process transparently — no raw PID management anywhere in the codebase.
Process restoration on boot. On startup, a module queries all non-delivered orders from the database and starts a GenServer for each one. Without this, existing orders would have no live process after a server restart.
PubSub decouples the pipeline from the UI. GenServers broadcast to a named PubSub topic. Any LiveView subscribed to “orders” receives the event and re-renders. Adding a second dashboard requires no changes to the pipeline layer.
Claude runs in a supervised Task. Long-running API calls run in a Task.Supervisor child. The websocket can time out without affecting the analysis. Results arrive via PubSub when ready.
Challenges
Learning Elixir/OTP from scratch under deadline pressure. Zero Elixir experience at the start. The functional-everything, no-classes, no-mutation model required rewiring instincts built over 7 years of PHP and Python. Every OTP concept was learned in the context of working code, not documentation.
GenServer naming conflict with DynamicSupervisor. The Order.Supervisor module clashed with the DynamicSupervisor registered under the same name in application.ex. Processes appeared to start but were never registered in the Registry — a silent failure that required reading the BEAM error output carefully to trace.
Test database and foreign key constraints. Adding the warehouses foreign key broke the entire test suite at once. Every order creation test failed because warehouse ID 1 didn’t exist in the test database. The fix required setup blocks in every describe group and updating fixtures to preload matching associations.
Preload inconsistency between fixture and context. After adding carrier and warehouse associations, tests failed with struct mismatches — one side had carrier: nil (preloaded), the other had carrier: #Ecto.Association.NotLoaded. The fix was ensuring fixtures preload exactly what the context functions return.
Lessons Learned
“Let it crash” is an architecture, not a philosophy. Before this project, the phrase was abstract. After writing the crash recovery test and watching the Supervisor restart a killed process with a new PID and correct state in under 50 milliseconds, it became concrete. The Supervisor is the error handler. Processes don’t need defensive code.
Rich context makes AI analysis useful. The first version of the exception analyzer sent just the order number and status to Claude. The output was generic. After adding inventory levels, exception duration, carrier, priority, and warehouse context, the analysis became specific enough to act on — with routing suggestions, inventory gap identification, and carrier alternatives grounded in real data.
Seed data is engineering, not data entry. The 370-line seed file has narrative patterns deliberately constructed — a Memphis warehouse at 25% exception rate, a UPS carrier outage on a specific date, a promotional volume spike. That’s what makes the Operations Dashboard tell a story and makes Claude’s exception analysis interesting.
DFT (Design For Test) is a discipline. We added the foreign key constraint before updating the test fixtures. 14 tests broke at once. The lesson: every schema change should be followed immediately by fixture and test updates, not deferred.